
When we tell LPs that biotech managers have been among the strongest contributors to our recent distributions, the reaction is often surprise. That's understandable given the prevailing narrative that biotech is a difficult, slow-to-liquidity corner of venture, and many venture investors have treated it accordingly.
Some of that perception is rooted in real shifts. Many generalist managers who historically invested in biotech with mixed success have pulled back, leaving specialist firms to carry the sector. By mid-2025, PitchBook reported that VCs had almost completely abandoned biotech investing. According to their data, biotech VC fundraising had fallen 92% from its 2018 peak, and biotech funds made up only about 3% of all venture capital raised in 2025 as AI absorbed new commitments.¹
Our view is that a dedicated life sciences sleeve is an important component of a venture program, best accessed via dedicated managers with technical expertise, regulatory experience and deep relationships with the pharmaceutical industry. Staying diversified into healthcare largely through specialist managers has meaningfully supported Cross Creek's portfolio liquidity, most notably by delivering strong liquidity during a period when technology exits were scarce.
Life Sciences Liquidity in Our Portfolio
TTM Distributions As % of NAV
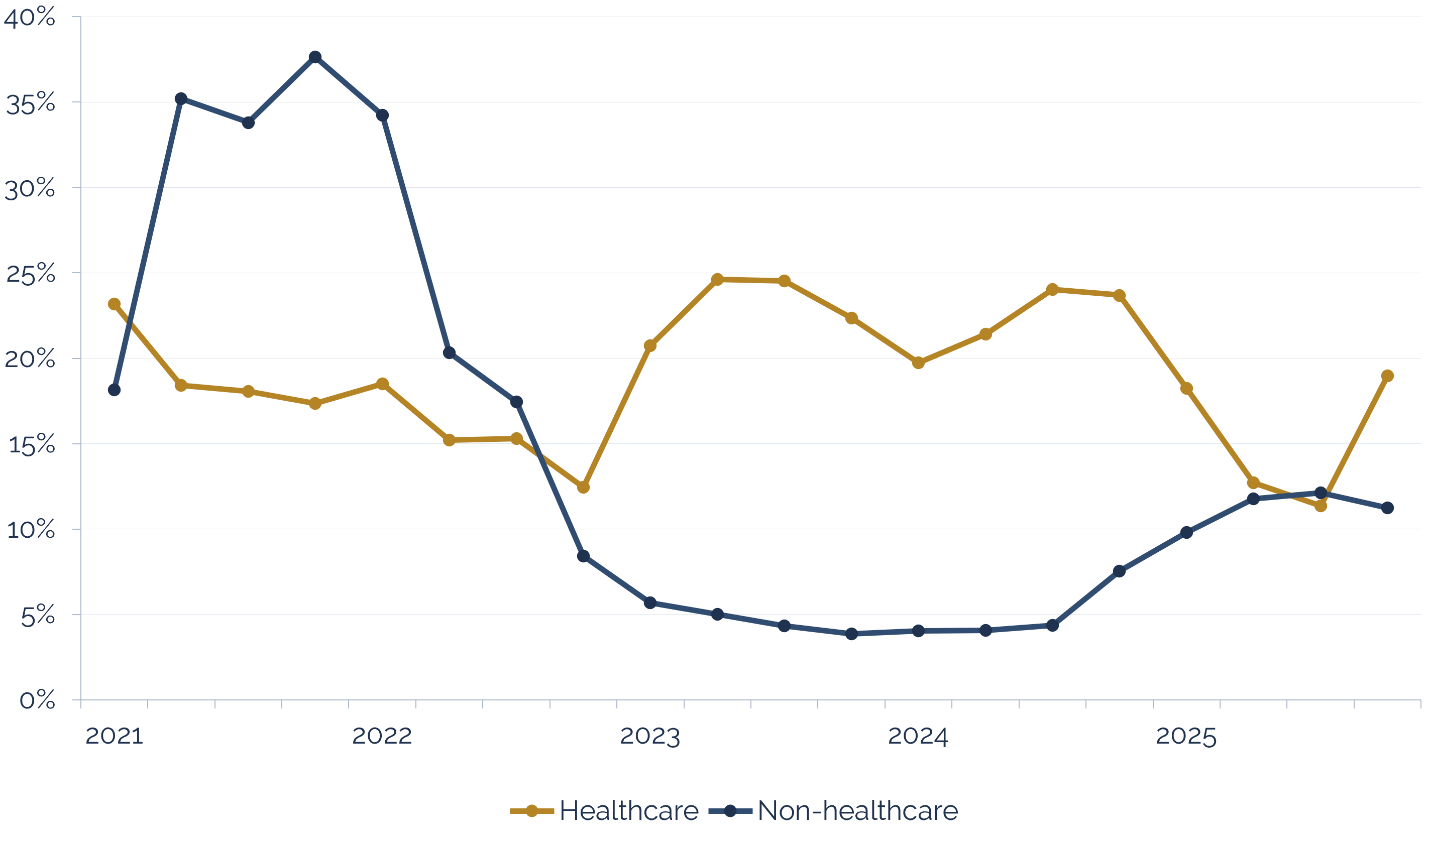
Note: Data as of 3/31/2026. Chart shows healthcare liquidity from Cross Creek Partners Program underlying managers for vintages 2008 through 2022. The data is not necessarily representative of the experience of other investors or future results. Distributions may include return of capital and do not represent investment returns or profitability. NAV and distribution information may be based in part on information reported by underlying fund managers and has not been independently verified. The methodology, classification of managers and composition of each category may affect the results presented. Past performance is not indicative of future results. Chart calculated from the trailing four quarters distributions as a percent of beginning NAV for the same period.
The chart above shows trailing quarterly distributions as a percentage of beginning NAV across funds in the Cross Creek Partners platform, split between healthcare focused managers and all other managers.
The headline: In 2023 through mid-2024, healthcare distributions ran at roughly 20% to 25% of NAV, while distributions from non-healthcare managers fell with the venture industry to about 5%.
The distributions from our life sciences funds provided a source of liquidity during a period when technology exit activity was limited. Tech liquidity has begun recovering in 2025, which is welcome news. But healthcare has remained a steady contributor.
And It's Not Just Us
While we believe we have chosen some of the leading biotech funds, other investors who maintained biotech exposure also appear to have seen a benefit, even as the broader market has moved away from the sector.
Healthcare VC vs. All VC Median DPI by Vintage Year
Cambridge Associates VC Benchmarks | 2007-2020 Vintages
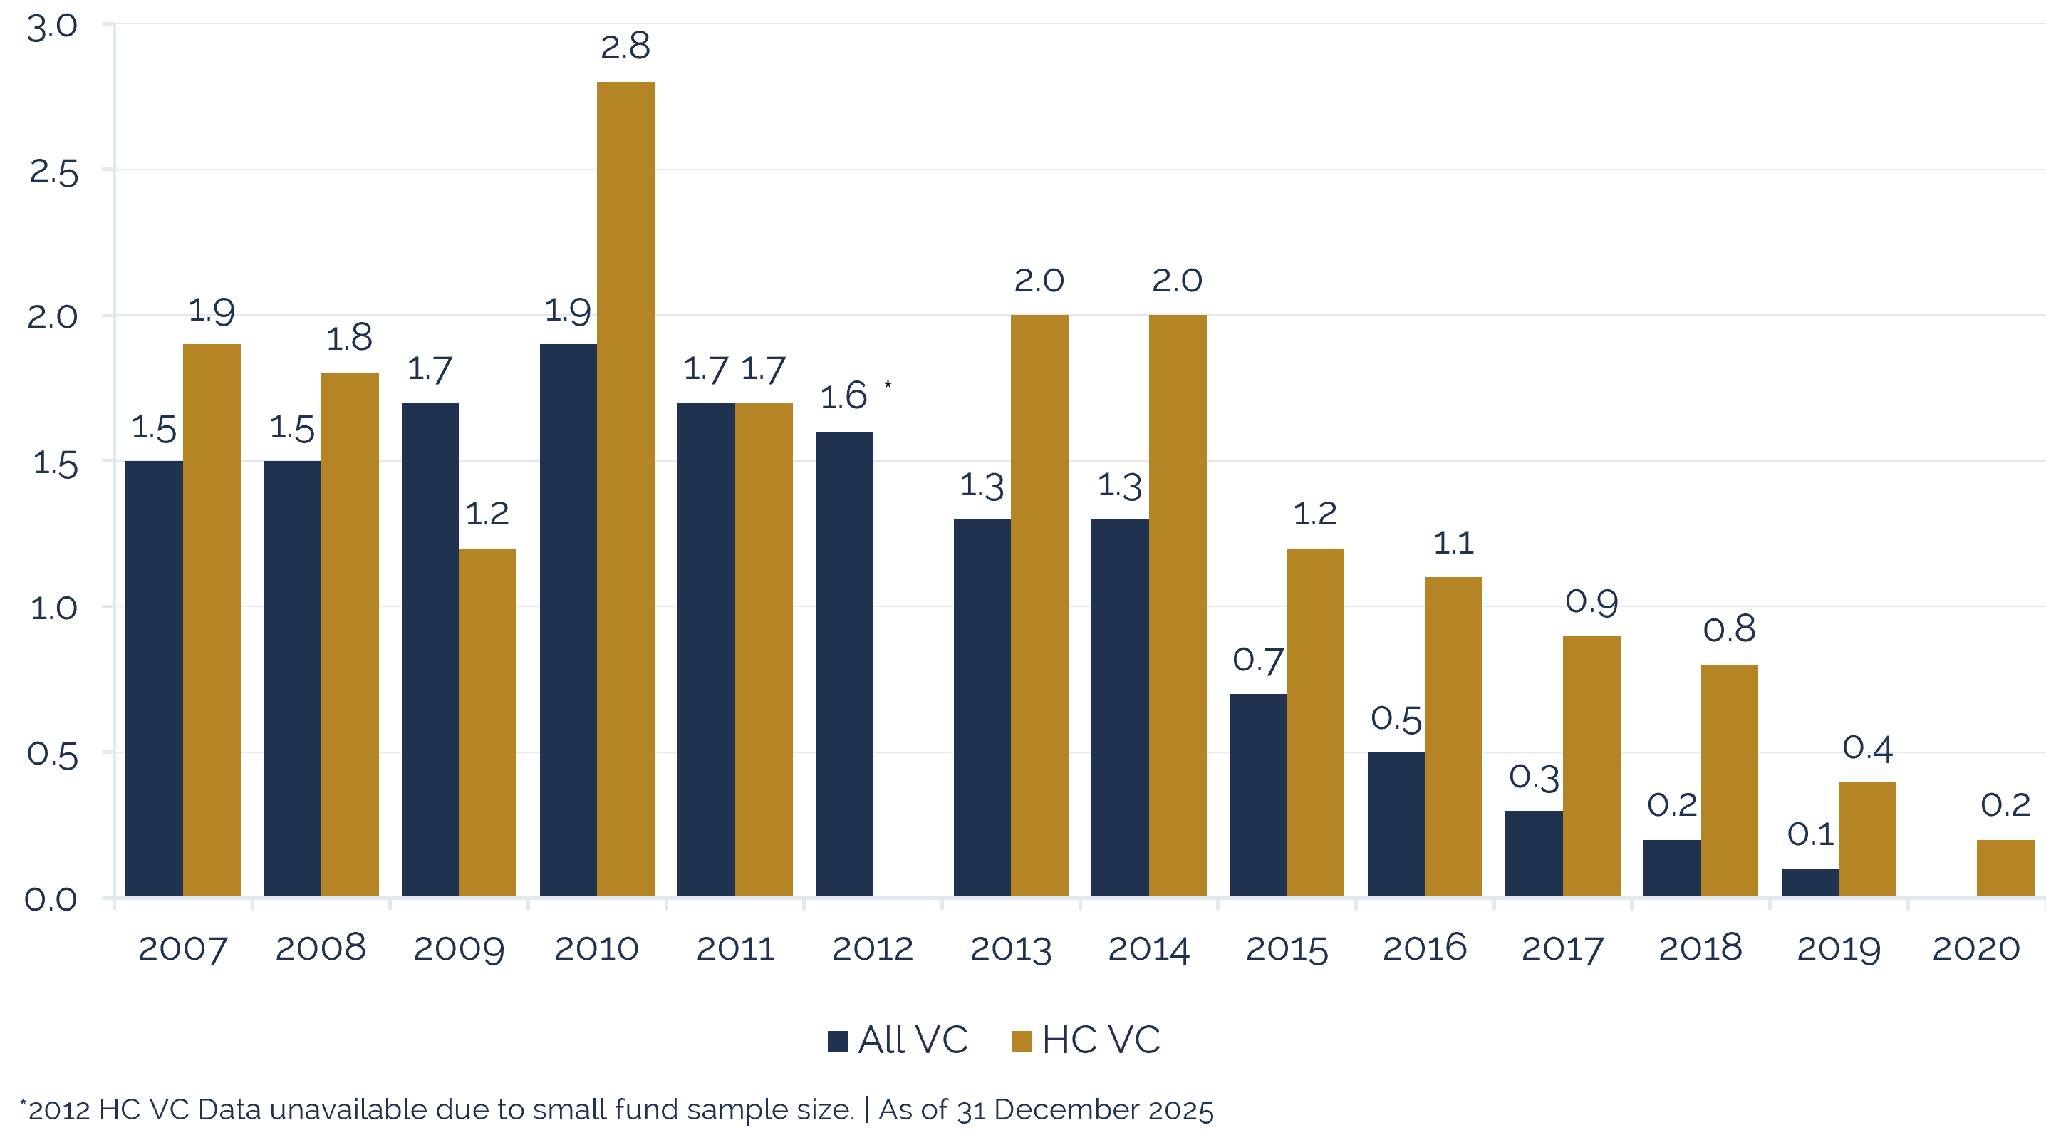
Cambridge Associates data in the chart above shows that healthcare VC median DPI exceeded the All VC benchmark in nearly every vintage from 2007 to 2020. The gap is especially striking in more recent vintages. The point here isn't that biotech will always deliver higher total returns, but that biotech has delivered earlier, more reliable cash back to investors in stark contrast to the conventional wisdom.
Why This Is Happening
Technology IPOs have been sparse over recent years, and technology M&A has been constrained, first by regulatory approval fears and then by the dynamic shift in valuation from SaaS to AI companies. But both exit channels, IPOs and M&A, have been marching steadily forward in life sciences.
The biotech index is notoriously volatile, and recent years have been no exception. But beneath that volatility, biotech listings have been steadier than technology listings over the 2022 to 2026 period, and 2026 has been a particularly strong year. UBS projects total biotech IPO deal value of roughly $10 billion this year, approaching the 2020 to 2021 peak of $14 to $15 billion.
M&A has been the real driver of liquidity. Biotech M&A volume has topped $133 billion year-to-date across 41 deals of $500 million or more, and is on pace to reach about $182 billion for the year. That would exceed 2025's $111 billion and potentially approach the 2019 record of roughly $195 billion.²
Pharmaceutical Innovation Gap
Three structural forces explain why the demand for venture-backed biotech companies is so strong.
First, big pharma faces a revenue gap it has to fill. The industry is approaching a major patent cliff. IQVIA estimates more than $230 billion of biopharma revenue will lose exclusivity by 2030, putting up to 65% of some large pharma companies' current sales at risk, with another $200 to $250 billion exposed in the early 2030s. Because drug patents expire on a predictable cycle, pharma must constantly replace lead products, either by inventing new ones or by acquiring products or companies.
Second, acquirers have strong balance sheets and the capacity to act. IQVIA estimates big pharma's deal capacity at roughly $1.3 trillion, and despite a rebound in dealmaking in 2025, much of that remains available for future transactions.
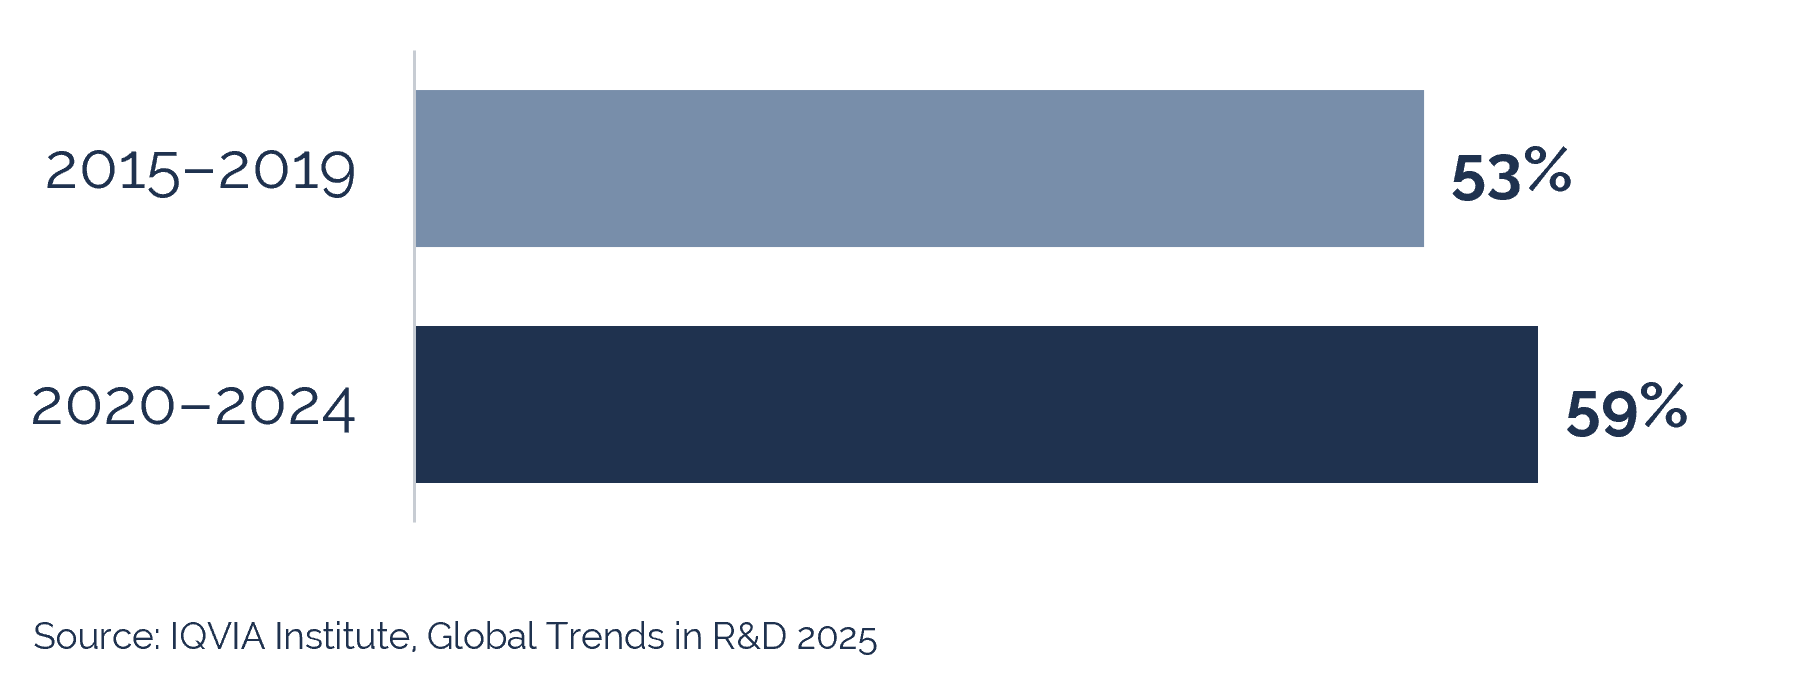
Third, emerging biotechs are the source of most new drugs. In 2024, 85% of the 48 novel active substances launched originated at emerging biopharma companies, and emerging companies have produced more than half of all launches every year since 2016. According to IQVIA, these companies now account for 70% of all clinical-stage assets in the industry pipeline, most of them unpartnered. For pharma, buying innovation has increasingly become the default way to replenish the pipeline.
Share of New Drug Launches Originated by Emerging Biopharma (Cumulative)
Looking Ahead
We continue to believe in biotech as a core part of a diversified venture program. We also believe the factors remain in place for life science managers to produce attractive returns and liquidity for investors.
This sector is less frenzied than AI and broader technology. With generalist capital largely gone and total venture capital being invested into the space near historic lows, specialist managers face less competition for the best opportunities.
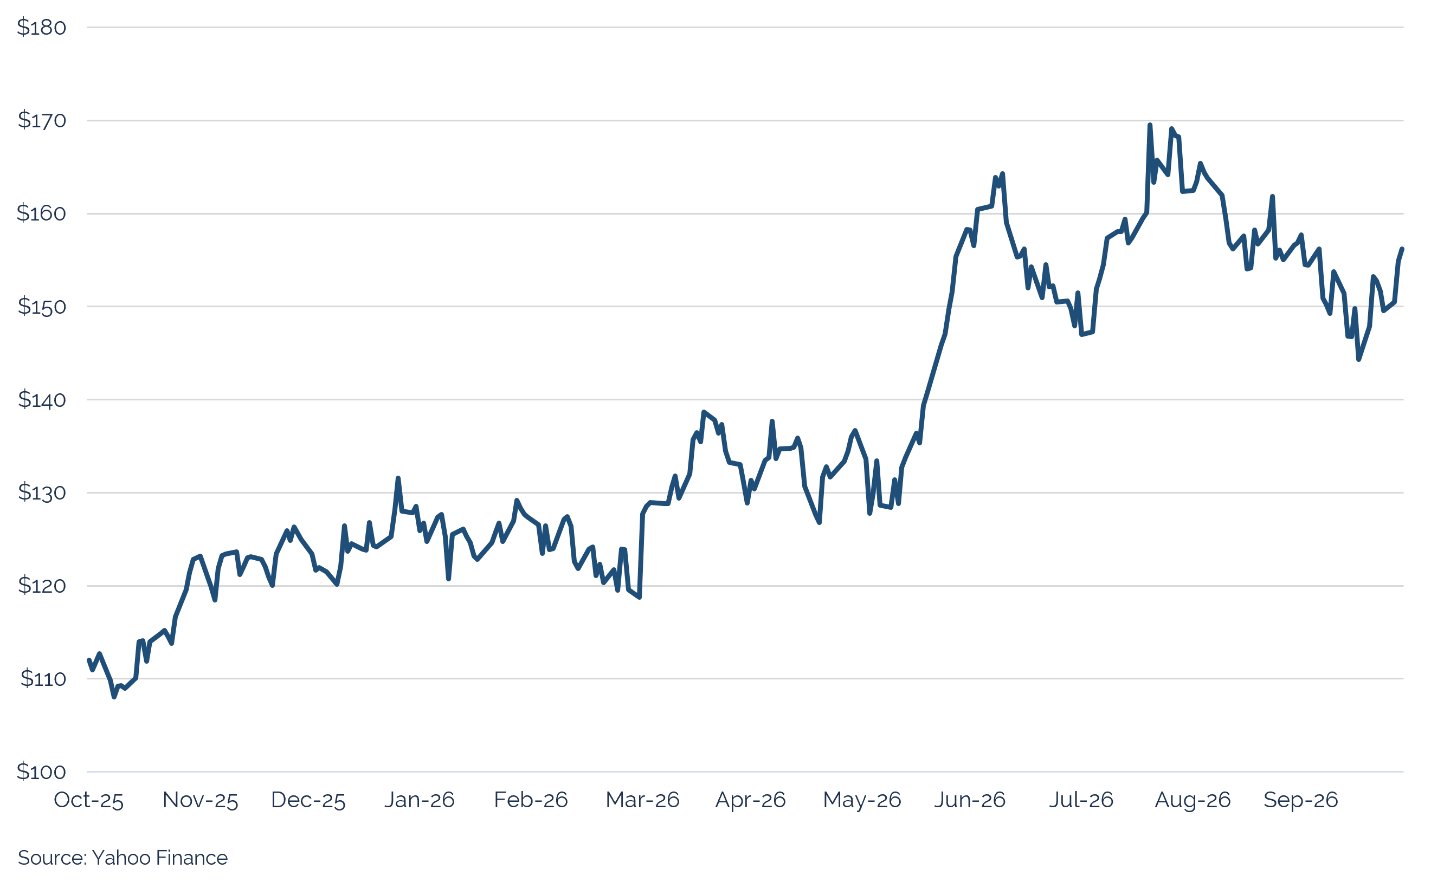
Meanwhile, the IPO market appears open. The XBI biotech index nearly doubled between late August 2025 and late August 2026, climbing from roughly $90 to almost $170 per share, setting a strong foundation for prospective public offerings. Of the 18 venture companies that went public in Q3 2026, 12 were healthcare-related according to Venture Monitor. These recent public offerings will provide future liquidity after the lock-up periods expire and the market appears open for future biotech IPOs.
XBI Closing Share Price
The structural forces also remain strong. Pharma's patent cliff and its balance sheet capacity aren't going away. Emerging companies continue to hold the assets large pharma needs and AI-enabled drug discovery has the potential to lift R&D productivity across the sector.
The lesson we've learned is that a diversified venture portfolio with specialist healthcare exposure can provide gains and liquidity when other sectors stall. That's why we've stayed committed to biotech, and why we expect it to remain an important part of how we construct diversified venture portfolios for our LPs.
Notes:
1. Rosie Bradbury, "VCs Have Almost Completely Abandoned Biotech Investing," PitchBook News, June 4, 2025, https://pitchbook.com/news/articles/vcs-have-almost-completely-abandoned-biotech-investing.
2. Andrew Tsai et al., Q3:26 Scorecard: Secondaries and M&A Slowed Q/Q, IPO Activity Holding Steady, Biotechnology Equity Research (San Francisco: Jefferies LLC, October 6, 2026), 10.
This material does not constitute an offer to sell or the solicitation of an offer to buy any securities. Securities of any fund are offered to selected investors only by means of a complete offering memorandum and related subscription materials which contain significant additional information about the terms of such an investment. The foregoing consists solely of recent news relating to certain Portfolio Companies. These Portfolio Companies do not represent all of the investments made or recommended by Cross Creek. The reader should not assume that an investment in any Portfolio Company identified was or will be profitable. Past performance is not indicative of future results. Investors should be aware that a loss of investment is possible. The research for this material is based on current public information that we consider reliable, but we do not represent that the information herein is accurate or complete, and it should not be relied on as such. Our views and opinions expressed herein are current as of the date this material is sent and are subject to change without notice. Not all acquisitions or IPOs are profitable; the positions can be acquired at a price that is greater or less than the price at which Cross Creek purchases its interests for client accounts. A link to Cross Creek's direct company holdings is available on our website.


